PROJECT OVERVIEW
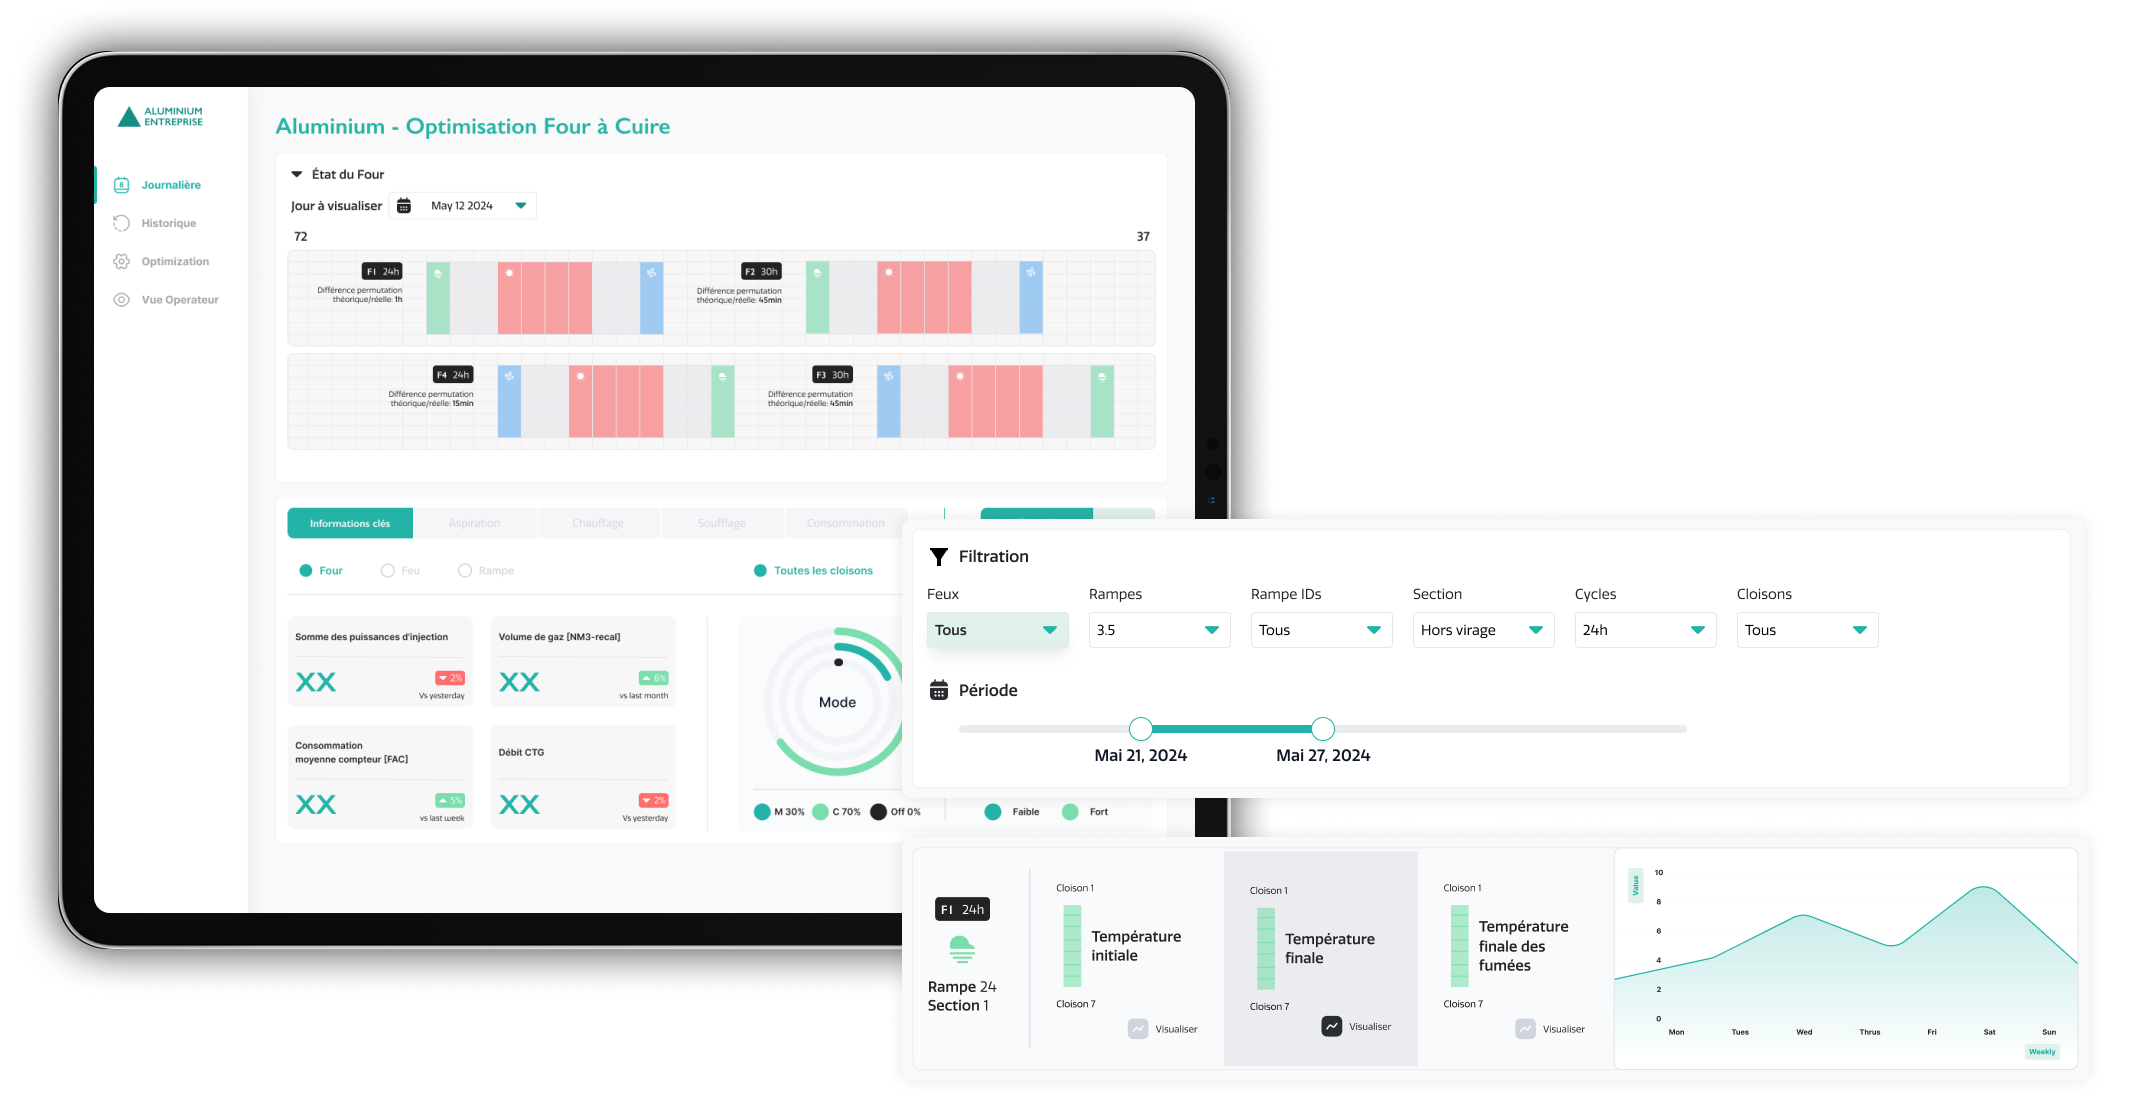
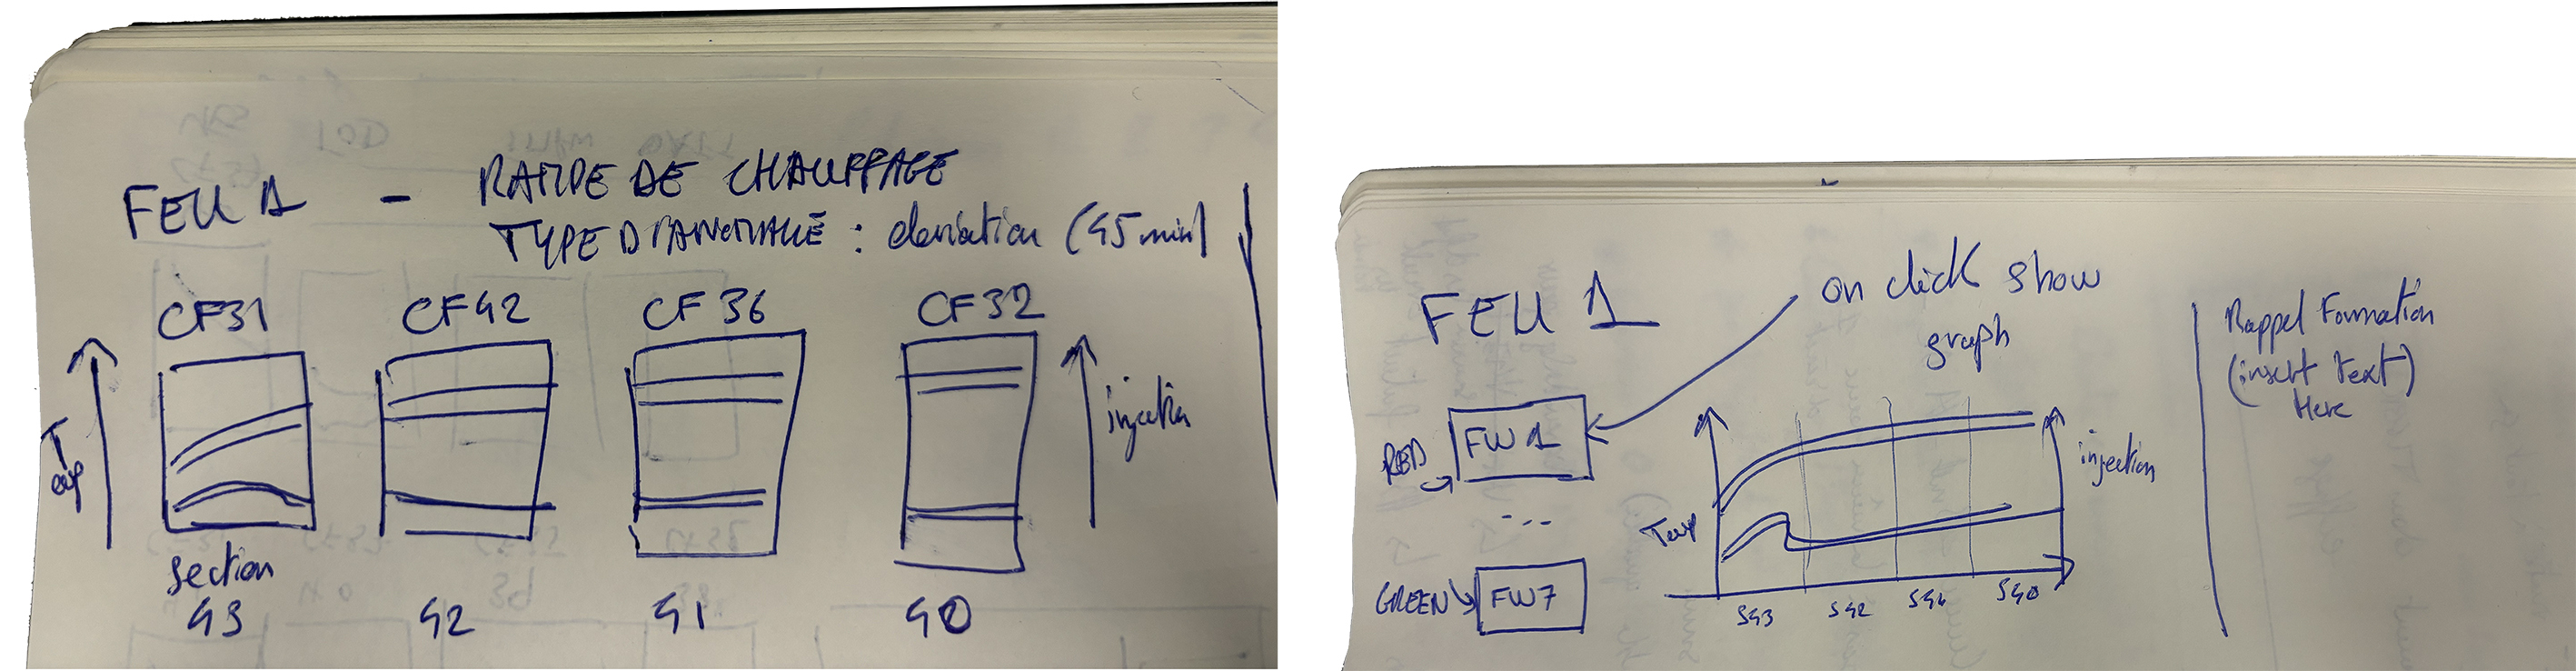
An aluminium enterprise operated industrial ovens where operators managed settings such as suction, heat, airflow, and consumption. By monitoring and adjusting these variables, they gained a clear understanding of the system and could fine-tune the environment within specific areas of the oven.